Programs for checking the temperature of the processor and video card. Processor and video card temperature - how to measure
The noise and slowness of the laptop may be the result of an increase in temperature and the subsequent increased work of the cooler of the laptop cooling system, which cannot cope with the load due to a decrease in its own efficiency.
So the slowdown in the work of applications can be noticeable after the temperature rises above 70-75 degrees. This is a consequence of the dynamic decrease in the frequency of the laptop's central processor (the so-called CPU throttling or throttling).
If the temperature rises further, the laptop may shut down to protect the system from overheating.
Permanent operation of a laptop with such a malfunction will lead to the failure of the motherboard. Most often, the northbridge or video card fails. I must say that the service is not cheap. Therefore, it is better to carry out express diagnostics and prevent costly repairs.
Common signs of a laptop overheating:
- the laptop starts to make more and more noise;
- the keyboard gets hot;
- Windows, games and other applications start to slow down.
Some inconvenience while working on a laptop that overheats (may help with diagnosis)
- The laptop is making a lot of noise. So the cooler constantly works at high speeds, which reduces its service life;
- The keyboard, touchpad and case get noticeably warm. It is not comfortable to work with such a device;
- The laptop is very slow. Programs stop responding (hang) - performance is degraded.
- The laptop may shut down suddenly. User data may be lost due to a sudden shutdown of the device. Turning it on immediately after turning it off is often not possible - it takes time for the processor and heatsink to cool down.
In order to properly diagnose and identify overheating of the laptop, some prerequisites are necessary:
- The presence of minimal knowledge of the person conducting the diagnosis. Correctly measure the temperature of the processor, laptop video cards you need to know and be able to do. You will also have to evaluate the degree of heating of the chipset in dynamics, taking into account time, load - mandatory requirements. It is advisable to navigate in terms of: normal temperature indicators of a laptop in idle state and under load;
- A program for monitoring temperature in dynamics and recording readings;
- A program for creating a controlled load on the CPU and GPU.
Test program
Download the AIDA64 Extreme Edition program from the link http://www.lavalys.com/support/downloads/;
We install it on a laptop (the program is in Russian, free for 30 days).
AIDA64 allows you to simultaneously load the central processor and monitor the dynamics of CPU warm-up in real time. Sometimes you can monitor the operation of the video card (GPU) - it all depends on the type of sensor in a particular laptop model.
Instructions for self-diagnosing laptop overheating
We launch the program and check the correct operation of the sensors and the program. Temperature readings should be between 35 and 55 degrees Celsius. If the readings are very different, it is possible that the sensors do not work quite correctly, or they are not read correctly by the program - this happens. In this case, you will have to find another software;

Go to the tabs Service -> System stability test. We press the Start button.


Under the influence of the load created by AIDA64, the CPU starts to warm up. It takes 5 to 10 minutes to conduct an accurate test. It makes no sense to load the laptop anymore. At the same time, it is worth paying more attention not even to the temperature, but to the dynamics of its growth. If growth is very rapid, most likely the laptop needs preventive cleaning from dust and replacement of thermal paste. Ideally, the temperature curve should be as flat as possible. In our case, they can help in this case.

The temperature of the processor for a regular laptop should not exceed 75-85 degrees - this is the maximum.
If AIDA64 is not suitable?
If for some reason it was not possible to use AIDA64 (the trial period has ended), pay attention to a tiny utility for measuring the temperature indicators of a laptop or computer - Open Hardware Monitor. You can download it. The program is characterized by a very small size distribution, only about 500Kb (~0.5Mb). It has a simple, intuitive and pleasant interface. The language is English, but it is very easy to understand it, since you only need to find the thermometer icon and temperature values \u200b\u200bfor the CPU. A simple and understandable tool for diagnosing possible overheating, especially since its readings and AIDA64 readings on a relatively old Lenovo G580 laptop completely converged.

It remains to find an effective program for warming up the processor to the maximum possible values and working on all Windows platforms from Windows 98 to Windows 8 (the program starts with a driver error - but the main functionality is normal). A veteran program, S&M, is suitable for this role. The utility is very good at loading the CPU, does not need to be installed and at the same time has a size of 150Kb. You can download the S&M program via a direct link from our website -.

For the test, you need to run both the S&M and Open Hardware Monitor programs and monitor the sensor readings. Approximate testing time is 3-5 minutes. For the fastest passing of tests, before starting the test, it is advisable to go to the S&M settings and move the processor test slider to the Fast position.
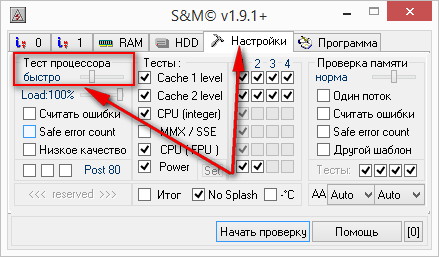
Click the Start test button and wait for the test results.

The temperature range for the central processing unit (CPU) should be between 45 and 75 degrees. Above these values - overheating.
In the same way, you can test overheating for a desktop computer. If necessary, other software will be required, but the algorithm will remain the same: monitoring the node under load and correctly interpreting the data received.

 The temperature of the components is one of the most important factors to pay attention to. As a rule, at its high values, the computer starts to work slowly, freeze and turn off spontaneously.
And since we are talking about the video card and processor, and these are the most important and productive components, they overheat most often. And in the worst case, if the temperature goes far beyond the norm, they are just.
Agree, to lose a graphics card worth 30,000 rubles. it would be embarrassing. To prevent this from happening, it is necessary at least sometimes to check the temperature of the video card and processor, both in games (under load) and in idle mode. Thanks to this control, you can take appropriate measures in a timely manner and avoid breakdowns.
There are several ways to check:
- You can check the temperature in the bios.
- Use special software.
Let's take a look at both methods and decide which one is best to use.
BIOS
Simply put, Bios is a menu in which you can view and change the necessary settings. Without downloading and installing third-party applications.
All you need is:

As you can see, everything is quite simple. However, this method has a very significant drawback. You will not be able to monitor thermal performance during normal system operation and increased load. Because while you are in the BIOS, the processor is in idle mode (no load).
Programs
There are many programs for measuring the temperature of a video card and processor, it makes no sense to sort through each of them, since they all perform the same task. I will only talk about the most popular and simple.
OCCT Perestroika
Program " perestroika» is designed to determine the temperature not only in idle mode, but also in tests. Completely in Russian.


It allows you to alternately check the video card and processor for stability, creating a maximum load on them.
In its functionality, it has 4 types of test:
- « CPU OCCT» is a standard processor test. Here you can set the duration of the test, set periods of inactivity, specify the bit depth and select the test mode.
- « CPU LINPACK” is the usual linpack from intel. Mostly used as a replacement for linx. Only the CPU is tested. Here you can also select the time of the check, the period of inactivity, specify the amount of memory consumed, enable AVX and enable the use of all CPU cores. Not recommended for use on laptops, netbooks, computers with a weak cooling system.
- « GPU 3D» — stress test of the video card. Something similar to Furmark. You can choose all the same verification modes, specify DirectX, set resolution, shader density and limit the number of frames.
- « POWER SUPPLY» - simultaneously checks the video card and processor, creating the maximum load. During the test, a large amount of energy is consumed, so if you have a weak and inexpensive power supply installed, be careful with this option.
After selecting the desired view, press "ON" to start. To end the test, use the "OFF" button.


In the right "Monitoring" window, the program shows the current temperature of the video card "GPU" and the processor "CPU".

I want to note that the utility is completely free and is supported by all versions of Windows, including Windows 10.
Open Hardware Monitor
Another small program with a fairly simple interface that is used to monitor temperature. Free, no installation required. The exact analogue of "HWMonitor". You can download it from office site developers.
With it, you can also monitor the performance of other components (hard drive, SSD, motherboard, etc.).
After launching the utility, select the device you are interested in, in my case it is the Intel Core i5-3470 processor. Click on the plus sign to open detailed information.


You can track temperature changes in the " Temperatures».
In addition, the utility shows the percentage of each core, the frequency of operation and voltage.
And in the section of the motherboard and video card, data on the operation of the "FAN" cooling system is displayed.
AIDA64
A fairly well-known program, which is a full-fledged monitoring complex capable of obtaining information about each device connected to a computer. Paid, but the developers provide a free trial period of 30 days. You can download it at office site.
To view the temperature, go to the " Computer - Sensors". Here you will see all the temperature indicators of the processor, video card, hard drive and other devices.


It can also be used to monitor the CPU and GPU in stress test mode. This will allow you to identify problems in the operation of a particular component. To run the test, go to the menu " Service' and select ' Stability test».


Tick the desired devices and click "Start".


As you have already noticed, the utility has a fairly large functionality, with which you can not only track certain indicators, but also test hardware.
Available in different languages, including Russian. Supported by Windows XP, 7, 8, 10.
HWiNFO
Temperature control can also be carried out using the HWiNFO program.
". It is completely free and can be downloaded from office site. I want to immediately note that it has 2 versions: installation and portable. What makes it the most convenient. But unfortunately, it does not have support for the Russian language.


At the time of launch, you will be offered 2 options for use:
- « Sensors only» will display a window with sensors.
- « summary only» - displays general information about your computer or laptop.
In order to see the current temperature of the processor or video card, select the first option.

The utility also displays information about the voltage and frequency of the components.
In its functionality, it has a number of settings that can greatly simplify monitoring. For example, you can set "Alerts" - "Alerts" for certain temperature indicators, upon reaching which, you will immediately receive notifications.


This may be a pop-up window, a soundtrack, a program launch, or a color change.
Speccy
Surely you know, or maybe you have heard of such a small program as "Speccy". It allows you not only to measure the temperature of the motherboard, processor, video card or hard drive, but also displays maximum information about the system and all installed hardware.


It was released by Piriform Ltd, which developed the well-known Ccleaner software. Thanks to such fame, the Speccy utility has been able to win the trust of many PC users.
You can download it from office site. Once launched, it will quickly scan the system and display all the data about each component.


GPU-Z
The main function of the program is an extended display of information about the video adapter, as well as reading indicators from sensors (temperature display). Distributed for free, but unfortunately, does not support the Russian language. You can download it from office portal developers.


After installation and launch, a window with all the characteristics of the video card will be displayed on the screen. In order to find out the temperature of the video card, you need to go to the tab " Sensors».


The data is updated automatically, so it is very convenient to keep track of its changes.
Here you can track the performance of the cooling system.
The utility allows you to take a screenshot of all values or save them to a file. Which in my opinion is very convenient.
What values to be wary of
Now let's look at which indicators are normal for each device, and which are critical:
- For a processor, up to 60 degrees is considered acceptable. In idle mode from 30 to 40 and under load from 45 to 55.
- For video card. Here you need to understand that the thermal values \u200b\u200bof each video card can be different, this is affected by the power and model of the graphics adapter. New video cards work well at 60-75 degrees, while for old ones, such indicators can be critical.
Summing up
So, we've covered 7 of the most popular ways to monitor GPU and CPU thermals. Which one to use is up to you.
The only thing I want to add from myself: programs are good, and live tests are even better. Therefore, in addition to using different programs, I recommend conducting real tests, while playing, while working in resource-intensive applications, etc.
If high thermal performance is detected, it is recommended to take it in a timely manner. This will help to avoid possible damage to the component.
Another way is covered in this video.
Professional help
If you are unable to fix the problem yourself,
then most likely the problem lies at a more technical level.
It can be: failure of the motherboard, power supply,
hard disk, video card, RAM, etc.
It is important to diagnose and fix the breakdown in time,
to prevent failure of other components.
Our specialist will help you with this.
Leave a request and get
Free consultation and diagnostics of a specialist!
If your computer unexpectedly shuts down, freezes, or stutters during intensive tasks, the cause may be overheating. Watching the chip temperature is also extremely important when you are overclocking your processor. You don't want to cripple the whole car by accelerating, do you?
This is extremely strange, but the Windows operating system does not offer any way at all to check the temperature of your processor. You can, of course, delve into the depths of your system's BIOS in search of this information, but isn't it too much trouble just to read the sensor reading? Fortunately for us, there are several free programs that will make it easy to get this information at any time you need.
How to Check Your CPU Temperature
The fastest and easiest way to find out the temperature of your processor is to download a utility that is directly called: Core Temp. However, be careful during installation! Like many free programs, this one will also try to install additional and completely unnecessary software if you do not uncheck the appropriate boxes during the installation process.
Once installed, Core Temp is able to tell you everything you need to know about the current state of the processor, including its average temperature, right at the bottom of the screen without any frills. If you want even more details, click the Show hidden icons button in the notification area, located on the right side of your Windows taskbar. You'll see a summary of temperatures listed separately for each core of your processor.
.jpg)
A summary of the temperature of each processor core provided by the Core Temp app
The Core Temp settings menu helps you adjust exactly what information you want to see in the notification area and how you see it. However, even the "default" configuration allows you to easily determine whether your processor is overheating, or its mode of operation does not cause concern.
I must say, the Core Temp program is not the only option. You can use HWInfo, a deep system monitoring tool that provides detailed information about every component of your computer's electronics. If your choice is to use this program in "sensors only" mode, scrolling down to the CPU section - that's it, not just CPU temperatures in the motherboard data - will take you to detailed temperature summaries and other pertinent performance data. processor.
Another popular program for monitoring the status of system unit components is Cam software from NZXT. It has a wide variety of skills, and its sleek interface is much easier to read without getting used to than many other monitoring tools.
.jpg)
Program from NZXT for monitoring the status of components of the system unit - Cam software
This program shows all kinds of useful information about your CPU, graphics card, RAM and hard drive. In addition to many other useful features, it contains a frame per second counter that can be called during the game with the hotkeys you set, moved to different corners of the screen and hidden again, as well as tools for overclocking the processor. Plus, you can use the Cam mobile apps to manage your app tabs while you're away from your computer.
But even if that doesn't help much, it's possible that your CPU cooler just isn't capable of handling the amount of heat it's getting from the CPU. Especially if you're trying to pair a modest "nameless" consumer cooler with a high-powered chip, and doubly so if you're overclocking your CPU. The next step may be buying a new cooler for the processor.
A Few Good Cooler Models You Might Need
Cooler Master Hyper 212 (about 2,400 rubles) is an excellent, reliable and affordable air cooler. With its larger heatsink and fan, it's a big step up from the simple market CPU coolers from AMD and Intel.
Stepping up in size and price is the Noctua NH-D14 (around Rs. The only “but” is that with its large size, it will most likely interfere with access to RAM, and it may simply not fit into small cases for system units.
Closed-loop liquid solutions (CLC) provide significantly lower CPU temperatures with minimal hassle - except for the cost of the cooler itself, which is more expensive than its "air" counterparts. The 120mm Corsair H80i v2 (~$6,400) is a great entry-level CLC, but if you're planning on overclocking your CPU, take a closer look at its sibling, the Corsair H100i v2 cooler ($7,600) with a huge 240mm heatsink that can keep your CPU cool. processor even during the most intense overclocking.
In our article, we will show some fairly simple ways to find out the processor temperature in Windows 7 without programs and with programs. The reason why some users may have such a need is the frequent shutdown of their personal computer, which can be caused primarily by overheating of the CPU. In order to control its temperature, you need to know its values. The instructions below include options, both using free third-party programs, and completely without them. We will also tell you what temperature the processor should have so that you can control this indicator.
To do this, it will be enough just to go into the BIOS of the computer. This information is shown in almost all PCs and laptops, maybe with the exception of only a few older models.
On many computers that have a built-in graphical interface, all information about the processor, including temperature, is displayed on the settings screen. The only drawback here is that this information only shows the temperature of the processor without its load. A convenient option for some users can also be to use the command line, but it does not work on every system. However, to work with PowerShell, you will need to follow these steps:
- First, on behalf of the administrator, we enter the command line section and write -get wmiobject msacpithermalzonetemperature name space root wmi
- After that, in another section, called Current Temperature, the temperature values \u200b\u200bof the processor cores appear, which are expressed in Kelvin.
- Next, we take these values and divide them by ten, then subtract the figure 273.15 from the amount received. Thus, we get temperature data on our Celsius scale.

Important! If after repeated execution of the command, the temperature values shown on the computer do not change in any way, then we can assume that this option is not suitable for you.
Using Core Temp
This program has been specially designed to obtain data on the temperature values of the processor during its operation. It is completely free and has a Russian interface. With its help, you can see the temperature of the cores, and the display of indicators is displayed separately on the Windows taskbar. In addition, the program can display other useful information about the processor and is often used by users to permanently display this data on the computer desktop as a processor performance meter. The application can be quickly downloaded from the developer's website. 
Working with CPUID HWMonitor
Currently, the CPUID HW Monitor program is one of the most convenient and popular. It is also free and is intended to provide information about both the general temperature values of the processor and its cores. An important additional function of the utility is the ability to control the temperature value of the processor socket. 
We measure the temperature of the processor using the HW Monitor program
This application differs from other programs in that it allows you to find out some additional technical characteristics, such as:
- fan operating speed;
- stresses of the main components;
- processor temperature;
- current load on the cores;
- temperature values of disks and video graphics.
Downloading HW Monitor will be better from the developer's website.
Speccy program
For all those who have only recently started using a personal computer or laptop, the best way to find out the processor temperature values \u200b\u200bis using the special Speccy application. The program has a Russian interface and is very easy to use. In addition to various information about the system, it also displays temperature readings from most of the computer's sensors, and the temperature of the processor itself is displayed in a separate section for the CPU. In addition to the processor Speccy gives you the opportunity to see the temperature of the motherboard and hard drive. 
Speedfan program
Another way to answer the question of how to find out the temperature of the processor in Windows 7 is to use the Speed Fan utility, which shows the fan speed for cooling the PC and the temperatures of the processor and hard drive. The program is constantly updated and can work with almost any motherboard. As additional functions, it provides the ability to create a graph of temperature changes, which will help track the difference in temperature conditions when playing on a computer and at a time when it is not involved in work. 
H.W.Info
The HW Info program is used to obtain data on the characteristics of various computer components and take data from its temperature sensors. To get this information, click on the "Sensors" icon, which is located in the main application window. You will see all the necessary temperature data in the processor section. There is also information about the temperature regime of the video card. You can download the application from the official website of the developer. 
A number of other programs for obtaining information about the temperature of the processor
If the options described above for some reason could not help you, then we can offer several other convenient tools with which you can not only find out the temperature of the processor, but also the motherboard, HDD and video chip. Here are just a few of them:

All these programs perform approximately the same functions, just some of them are much more convenient to work with and they are faster than others. 
What temperature should the processor be
This temperature is the following average values:
- 30 -40 degrees correspond to the normal mode when the computer is idle, when the Windows desktop is shown, but at the same time, no other operations are performed on the PC.
- 40 -60 degrees should be at a good load if games are played on the computer or any complex tasks related to archiving or something else that require enhanced processor work are being solved with its help.
- 66 - 71 degrees - this is the maximum limit that is allowed when the CPU is running.
I would like to note that the normal temperature range for AMD is almost the same and may differ only in a few of the most recent models. In the case when the operating temperature of the processor rises to such values as 90 - 100 degrees, many of them include skipping cycles, and if the temperature continues to rise, they simply turn off.
Some useful information
If the internal temperature in the room rises by 1 degree, then this leads to an increase in the temperature of the processor by 1.5 degrees. Also, it can be significantly affected by the presence or absence of a large free space inside the device case. And because of this, the temperature of the processor can vary from 5 to 10 degrees upward. The same changes can be observed when a personal computer is placed in a special table. Therefore, the placement of the PC must be treated with sufficient caution.
How to find out the temperature of the processor, hard drive and video card: video
Our article talked in detail about how to find out the temperature of the processor in Windows 7 using a variety of methods (without programs and with programs), and you also found out what temperature the processor should have. Options were shown using the command line and third-party programs. Try them out and choose the one that suits you best.
One of the factors affecting the speed of a computer / laptop is the temperature of the processor, video card and other components. The higher the temperature, the slower the computer/laptop will run. If the processor is very hot, the video card may fail, and long-term operation in high heat mode reduces its service life. At critical temperatures, the device will spontaneously turn off (protection against overheating). In order to prevent overheating of the processor, video card and other components of a computer / laptop, it is necessary to periodically monitor the temperature and, at critical values, take measures to reduce it. How and how to check the temperatures of the processor, video card and how to reduce the temperature will be described in this article.
There are two ways to check the temperature of the processor, video card and other computer/laptop components:
1 View temperature in BIOS;
2 Use third-party programs.
Find out the temperature of the processor and other components in the BIOS.
In order to get into the BIOS when booting a computer, laptop, press the F2 or Del key (the buttons may differ, depending on the model of the motherboard). Then in the settings you need to find the Power / Monitor menu in different versions of the BIOS will be different. There you will see the temperature of the processor, motherboard, etc..
I will give an example of how I watched the temperature on the ASUS motherboard in UEFI (Unified Extensible Firmware Interface - a replacement for the obsolete BIOS, used in modern motherboards). Once you are in UEFI, click the "Advanced" button.
After that, go to the "Monitor" tab, you will see the temperature of the processor, motherboard and much more information.

Thus, without installing any programs, you can find out the temperatures of the computer / laptop components. The disadvantage of this method is that not all motherboards have this option and it is impossible to see the processor temperature under load (when running "heavy" programs or games).
Find out the temperature of the processor, video card using programs.
There are a large number of different programs that will show you online the temperature values of computer / laptop components. In this article, I will analyze several of these applications and give my assessment of their work.
Find out the temperature of computer / laptop components using the AIDA64 program.
AIDA64 is one of the most popular computer/laptop review and diagnostic software. AIDA64 provides comprehensive information about the composition of the computer: hardware, programs, operating system, network and connected devices, and also shows the temperature of all devices on the computer / laptop.
The window of the program, which shows the temperature data from the sensors.

It should be said that the program is paid and trial version (30 days) does not show information about all devices, in my opinion this is the main disadvantage of this program.
Find out the temperature of the processor, video card using the Speccy program.
Speccy is a small utility from the developers of the most popular application for cleaning your computer of system junk CCleaner. At startup, Speccy monitors the hardware of the computer, and displays information about the operating system, the characteristics of the installed hardware, and data from sensors.
Below the program interface.

In my opinion, one of the best programs for determining the temperature of the processor, video card, etc. In addition to information from sensors, it also provides a detailed analysis of all hardware installed on a computer / laptop. The big plus is that the program is free.
Find out the temperature of the processor, video card using the CPUID HWMonitor program.
CPUID HWMonitor - a program designed to monitor the performance of various components of a computer / laptop (temperature, fan speed, and voltage).
Below is the interface of this program.

In my opinion, the ideal solution for those who are only interested in information about the temperature of all PC components. No unnecessary information, only temperature and fan speed, plus minimum and maximum values are shown, in addition, this program is absolutely free.
What should be the temperature of the processor and video card.
Different processor manufacturers set their own temperature, but generally speaking, the temperature should be between 30 -45 ° C in idle, up to 60-65 ° C in load, anything above is considered critical. Let me explain that these are average values, you need to look for more specific information on the website of your processor manufacturer.
For a video card, the normal temperature is up to 50-55°C at idle, under load up to 75-80°C. These average values can be found on the website of the manufacturer of your video card.
What to do when the temperature of the processor, video card is high.
1 Clean your computer/laptop from dust. Make sure all coolers and vents are free of dust. This is the most common overheating problem in a computer or laptop. To eliminate it, you need to disassemble the computer / laptop and remove all the dust that interferes with cooling.
2 Replace thermal paste. Thermal paste is a layer of thermally conductive compound (usually multi-component) between the processor and the heatsink. Over time, this paste dries up and loses its properties, because of this, the processor and video card overheat. To replace it, you need to disassemble the computer, remove the old thermal paste from the laptop and apply a new one in a THIN layer. Typically, thermal paste is replaced when cleaning a computer / laptop from dust.
3 Replace the radiatorcooler. You should choose a better heatsink, cooler for better cooling of the computer. In addition, it is quite possible that an additional cooler should be installed on the case for better heat dissipation from the computer.
I hope I helped you determine the temperature of the processor, video card and you were able to reduce it and achieve faster and more stable operation of your computer / laptop.